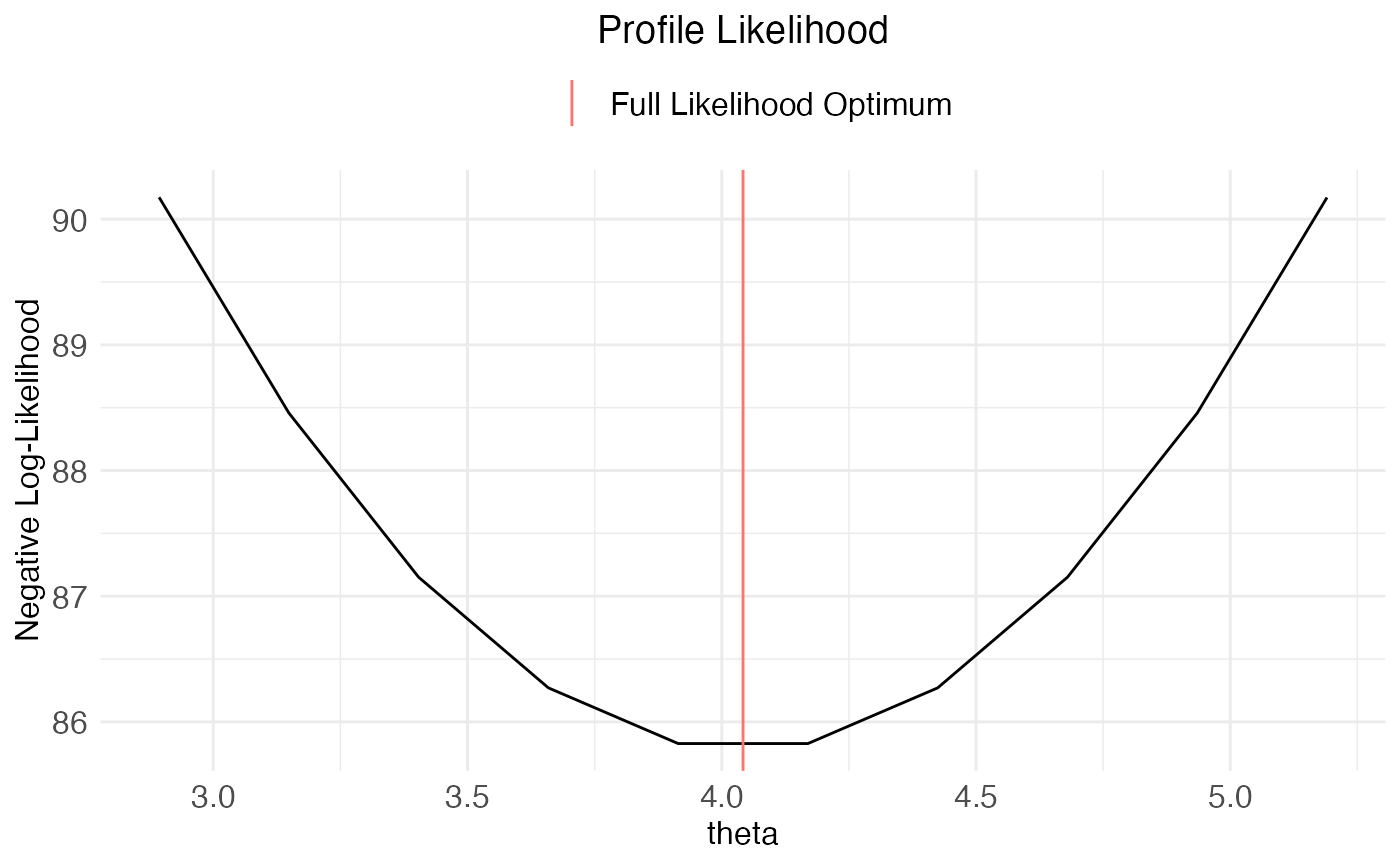
Plot a profile likelihood ctsmTMB object
Usage
# S3 method for class 'ctsmTMB.profile'
plot(x, y, include.opt = TRUE, ...)Examples
library(ctsmTMB)
model <- ctsmTMB$new()

# create model
model$addSystem(dx ~ theta * (mu+u-x) * dt + sigma_x*dw)
model$addObs(y ~ x)
model$setVariance(y ~ sigma_y^2)
model$addInput(u)
model$setParameter(
  theta   = c(initial = 1, lower=1e-5, upper=50),
  mu      = c(initial=1.5, lower=0, upper=5),
  sigma_x = c(initial=1, lower=1e-10, upper=30),
  sigma_y = 1e-2
)
model$setInitialState(list(1,1e-1))

# fit model to data
fit <- model$estimate(Ornstein)
#> Checking model components...
#> Compiling C++ function pointers...
#> Checking and setting data...
#> Constructing objective function and derivative tables...
#> Minimizing the negative log-likelihood...
#>   0:     160.35328:  1.00000  1.50000  1.00000
#>  10:     89.603625:  2.58436  2.91384  1.15608
#> 	 Optimization finished!:
#>             Elapsed time: 0.006 seconds.
#>             The objective value is: 7.387879e+01
#>             The maximum gradient component is: 9.9e-08
#>             The convergence message is: relative convergence (4)
#>             Iterations: 19
#>             Evaluations: Fun: 29 Grad: 20
#>             See stats::nlminb for available tolerance/control arguments.
#> Returning results...
#> Finished!

# calculate profile likelihood
# out <- profile(fit,parlist=list(theta=NULL))
out <- profile(fit,parlist=list(theta=NULL, mu=NULL))
#> Iteration: 1 / 100
#> Iteration: 2 / 100
#> Iteration: 3 / 100
#> Iteration: 4 / 100
#> Iteration: 5 / 100
#> Iteration: 6 / 100
#> Iteration: 7 / 100
#> Iteration: 8 / 100
#> Iteration: 9 / 100
#> Iteration: 10 / 100
#> Iteration: 11 / 100
#> Iteration: 12 / 100
#> Iteration: 13 / 100
#> Iteration: 14 / 100
#> Iteration: 15 / 100
#> Iteration: 16 / 100
#> Iteration: 17 / 100
#> Iteration: 18 / 100
#> Iteration: 19 / 100
#> Iteration: 20 / 100
#> Iteration: 21 / 100
#> Iteration: 22 / 100
#> Iteration: 23 / 100
#> Iteration: 24 / 100
#> Iteration: 25 / 100
#> Iteration: 26 / 100
#> Iteration: 27 / 100
#> Iteration: 28 / 100
#> Iteration: 29 / 100
#> Iteration: 30 / 100
#> Iteration: 31 / 100
#> Iteration: 32 / 100
#> Iteration: 33 / 100
#> Iteration: 34 / 100
#> Iteration: 35 / 100
#> Iteration: 36 / 100
#> Iteration: 37 / 100
#> Iteration: 38 / 100
#> Iteration: 39 / 100
#> Iteration: 40 / 100
#> Iteration: 41 / 100
#> Iteration: 42 / 100
#> Iteration: 43 / 100
#> Iteration: 44 / 100
#> Iteration: 45 / 100
#> Iteration: 46 / 100
#> Iteration: 47 / 100
#> Iteration: 48 / 100
#> Iteration: 49 / 100
#> Iteration: 50 / 100
#> Iteration: 51 / 100
#> Iteration: 52 / 100
#> Iteration: 53 / 100
#> Iteration: 54 / 100
#> Iteration: 55 / 100
#> Iteration: 56 / 100
#> Iteration: 57 / 100
#> Iteration: 58 / 100
#> Iteration: 59 / 100
#> Iteration: 60 / 100
#> Iteration: 61 / 100
#> Iteration: 62 / 100
#> Iteration: 63 / 100
#> Iteration: 64 / 100
#> Iteration: 65 / 100
#> Iteration: 66 / 100
#> Iteration: 67 / 100
#> Iteration: 68 / 100
#> Iteration: 69 / 100
#> Iteration: 70 / 100
#> Iteration: 71 / 100
#> Iteration: 72 / 100
#> Iteration: 73 / 100
#> Iteration: 74 / 100
#> Iteration: 75 / 100
#> Iteration: 76 / 100
#> Iteration: 77 / 100
#> Iteration: 78 / 100
#> Iteration: 79 / 100
#> Iteration: 80 / 100
#> Iteration: 81 / 100
#> Iteration: 82 / 100
#> Iteration: 83 / 100
#> Iteration: 84 / 100
#> Iteration: 85 / 100
#> Iteration: 86 / 100
#> Iteration: 87 / 100
#> Iteration: 88 / 100
#> Iteration: 89 / 100
#> Iteration: 90 / 100
#> Iteration: 91 / 100
#> Iteration: 92 / 100
#> Iteration: 93 / 100
#> Iteration: 94 / 100
#> Iteration: 95 / 100
#> Iteration: 96 / 100
#> Iteration: 97 / 100
#> Iteration: 98 / 100
#> Iteration: 99 / 100
#> Iteration: 100 / 100

# plot profile
plot(out)